Cap and Trade
The Focus Fusion Society › Forums › Noise, ZPE, AGW (capped*) etc. › Cap and Trade
- This topic has 114 replies, 12 voices, and was last updated 16 years, 1 month ago by
Rezwan.
-
AuthorPosts
-
October 2, 2009 at 8:46 pm #4607
 BreakableKeymaster
It’s very interesting to me how nobody likes the high fuel prices,
but everyone fails to notice the current subsidies on coal and oil,
which can be from 100 to 6000 usd per Capita per year, depending on how you calculate:
http://cleantech.com/news/node/554
http://newsbusters.org/blogs/d-s-hube/2008/07/01/r-f-k-jr-oil-coal-subsidies-over-2-trillion-yearOctober 2, 2009 at 10:26 pm #4608Brian H
ParticipantHermannH wrote: Brian, I am still confused. You propose that we we maximize CO2 and CH4 output to stop and reverse a global cooling trend that has been going on for centuries. And I understand that you believe the extra CO2 as a side benefit also enhances plant growth.
Let’s put aside for a moment discussions about the reality/severity of the cooling trend and the potential negative consequences of a warmer world.
What I like to point out here is that you imply that the greenhouse effect does work! So how are the climatologists frauds when they predict a couple of degrees global warming due to increased levels of CO2 and CH4?
The logic is: CH4 does the warming, CO2 does the plant growth. As for CO2 warming, my assertion is that EVEN IF it were true, it would be a good thing. But since hoomon CO2 contributions are about 0.125% of GH gas in the atmosphere, it is entirely irrelevant. Diurnal and seasonal swings are much wider than that, and so you could double-or-nothing all we do and not be able to detect the effect.
October 3, 2009 at 12:27 am #4609HermannH
ParticipantBrian H wrote:
The logic is: CH4 does the warming, CO2 does the plant growth. As for CO2 warming, my assertion is that EVEN IF it were true, it would be a good thing. But since hoomon CO2 contributions are about 0.125% of GH gas in the atmosphere, it is entirely irrelevant. Diurnal and seasonal swings are much wider than that, and so you could double-or-nothing all we do and not be able to detect the effect.Interesting logic, but before we can apply it we need to agree on some underlying facts.
According to this http://www.esrl.noaa.gov/gmd/ccgg/trends/co2_data_mlo.html CO2 concentrations in the atmosphere have risen from 320 ppm to 380 ppm in the last 50 years alone. These are actual measurements not predictions or speculation. The pre-indusrial level has been estimated to have been around 280 ppm. The oceans also absorbed a significant amount of CO2 in that time frame. That is a 20% increase since 1960 and I don’t think that anybody seriously disputes the numbers nor the claim that the lion share (if not all) of the increase is the result of human activity. This number is 160 times higher than your stated value of 0.125% human contribution (unless you only count the air that we exhale). In the graph you can also see that seasonal swings are much smaller than the long term trend and diurnal variations are invisible. Where do your numbers come from?
According to this http://en.wikipedia.org/wiki/Greenhouse_gas the warming effect of CO2 is three times higher than that of CH4, given their current concentrations in the atmosphere. These are numbers that are based on well known chemical and physical properties of the molecules and their distributions in the atmosphere. These properties are measured in a lab, there is no climate modeling involved. So I don’t understand how you can postulate that CH4 does the warming, and CO2 does not.
I am glad to see you agreeing that global warming (or the reversal of a cooling trend) is the result of having increased concentrations of a greenhouse gas in the atmosphere. That is exactly what the climatologists are saying, except they also include CO2! So how come they are frauds?
October 3, 2009 at 1:16 am #4610ParticipantHermannH wrote:
The logic is: CH4 does the warming, CO2 does the plant growth. As for CO2 warming, my assertion is that EVEN IF it were true, it would be a good thing. But since hoomon CO2 contributions are about 0.125% of GH gas in the atmosphere, it is entirely irrelevant. Diurnal and seasonal swings are much wider than that, and so you could double-or-nothing all we do and not be able to detect the effect.
Interesting logic, but before we can apply it we need to agree on some underlying facts.
According to this http://www.esrl.noaa.gov/gmd/ccgg/trends/co2_data_mlo.html CO2 concentrations in the atmosphere have risen from 320 ppm to 380 ppm in the last 50 years alone. These are actual measurements not predictions or speculation. The pre-indusrial level has been estimated to have been around 280 ppm. The oceans also absorbed a significant amount of CO2 in that time frame. That is a 20% increase since 1960 and I don’t think that anybody seriously disputes the numbers nor the claim that the lion share (if not all) of the increase is the result of human activity. This number is 160 times higher than your stated value of 0.125% human contribution (unless you only count the air that we exhale). In the graph you can also see that seasonal swings are much smaller than the long term trend and diurnal variations are invisible. Where do your numbers come from?
According to this http://en.wikipedia.org/wiki/Greenhouse_gas the warming effect of CO2 is three times higher than that of CH4, given their current concentrations in the atmosphere. These are numbers that are based on well known chemical and physical properties of the molecules and their distributions in the atmosphere. These properties are measured in a lab, there is no climate modeling involved. So I don’t understand how you can postulate that CH4 does the warming, and CO2 does not.
I am glad to see you agreeing that global warming (or the reversal of a cooling trend) is the result of having increased concentrations of a greenhouse gas in the atmosphere. That is exactly what the climatologists are saying, except they also include CO2! So how come they are frauds?
The numbers don’t even begin to add up. The hooman output in toto is a minute fraction of that change in concentration. And the lab results don’t reflect atmospheric dynamics. All the IR which can be absorbed by CO2 (actually, it’s delayed on its way to outer space, not absorbed, as it is re-emitted by the CO2 molecules it warms) is already, except for a fraction of a percent (the absorption curve is asymptotic, and is now moving out on the ‘long tail’ of that last tiny fraction). The point about CH4 is that it has more slack to take up, unlike CO2, which might help reduce the cooling now beginning.October 3, 2009 at 2:08 am #4611ParticipantBrian H wrote:
The numbers don’t even begin to add up. The hooman output in toto is a minute fraction of that change in concentration. And the lab results don’t reflect atmospheric dynamics. All the IR which can be absorbed by CO2 (actually, it’s delayed on its way to outer space, not absorbed, as it is re-emitted by the CO2 molecules it warms) is already, except for a fraction of a percent (the absorption curve is asymptotic, and is now moving out on the ‘long tail’ of that last tiny fraction). The point about CH4 is that it has more slack to take up, unlike CO2, which might help reduce the cooling now beginning.‘The numbers don’t even begin to add up.’
Did you check the links that I provided? If so, what does not add up?
Where did you find your number of 0.125% human contribution? What exactly does it mean? (Why do you keep spelling it ‘hooman’?)‘All the IR which can be absorbed by CO2 … is already’
This is from the IPPC report. http://www.grida.no/publications/other/ipcc_tar/?src=/climate/IPCC_tar/wg1/044.htmIt has been suggested that the absorption by CO2 is already saturated so that an increase would have no effect. This, however, is not the case. Carbon dioxide absorbs infrared radiation in the middle of its 15 mm band to the extent that radiation in the middle of this band cannot escape unimpeded: this absorption is saturated. This, however, is not the case for the band’s wings. It is because of these effects of partial saturation that the radiative forcing is not proportional to the increase in the carbon dioxide concentration but shows a logarithmic dependence. Every further doubling adds an additional 4 Wm-2 to the radiative forcing.
The other human-made greenhouse gases add to the effect of increased carbon dioxide. Their total effect at the surface is often expressed in terms of the effect of an equivalent increase in carbon dioxide.
Of course you probably won’t believe a word of it.
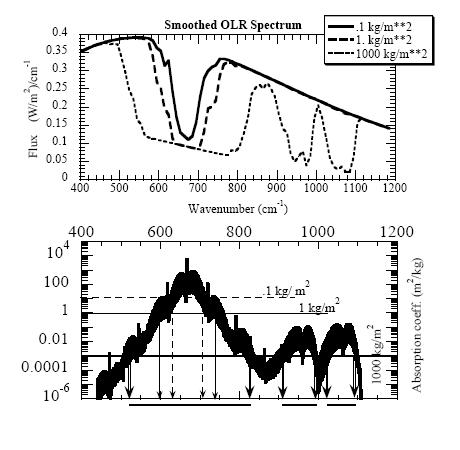
I found a more technical discussion here: http://www.physicsforums.com/showthread.php?t=243619
The salient point seems to be embodied in this graph: The absorption bands get wider with increased densities of CO2.October 3, 2009 at 2:38 am #4612ParticipantHermannH wrote:
The numbers don’t even begin to add up. The hooman output in toto is a minute fraction of that change in concentration. And the lab results don’t reflect atmospheric dynamics. All the IR which can be absorbed by CO2 (actually, it’s delayed on its way to outer space, not absorbed, as it is re-emitted by the CO2 molecules it warms) is already, except for a fraction of a percent (the absorption curve is asymptotic, and is now moving out on the ‘long tail’ of that last tiny fraction). The point about CH4 is that it has more slack to take up, unlike CO2, which might help reduce the cooling now beginning.
‘The numbers don’t even begin to add up.’
Did you check the links that I provided? If so, what does not add up?
Where did you find your number of 0.125% human contribution? What exactly does it mean? (Why do you keep spelling it ‘hooman’?)‘All the IR which can be absorbed by CO2 … is already’
This is from the IPPC report. http://www.grida.no/publications/other/ipcc_tar/?src=/climate/IPCC_tar/wg1/044.htmIt has been suggested that the absorption by CO2 is already saturated so that an increase would have no effect. This, however, is not the case. Carbon dioxide absorbs infrared radiation in the middle of its 15 mm band to the extent that radiation in the middle of this band cannot escape unimpeded: this absorption is saturated. This, however, is not the case for the band’s wings. It is because of these effects of partial saturation that the radiative forcing is not proportional to the increase in the carbon dioxide concentration but shows a logarithmic dependence. Every further doubling adds an additional 4 Wm-2 to the radiative forcing.
The other human-made greenhouse gases add to the effect of increased carbon dioxide. Their total effect at the surface is often expressed in terms of the effect of an equivalent increase in carbon dioxide.
Of course you probably won’t believe a word of it.
I found a more technical discussion here: http://www.physicsforums.com/showthread.php?t=243619
The salient point seems to be embodied in this graph: The absorption bands get wider with increased densities of CO2.
3.5% of GH gas is CO2. 3.5% of CO2 fluctuation is hoomon (as the Ferengi say it) output. 3.5% of 3.5% is 0.125%. All covered in earlier posts.The widening of the absorption bands is slight, and is the tiny added absorption which doubling, quadrupling, etc. of CO2 could achieve.
Have some geological perspective, on the house:
http://www.biocab.org/Climate_Geologic_Timescale.htmlOctober 3, 2009 at 5:00 am #4613Lerner
ParticipantNot to get involved in this interesting discussion–don’t have time–but people do need to do arithmetic right. Fossil fuel burning releases to the atmosphere about 200% of the CO2 needed to account for the increase in atmospheric CO2, not 3.5%.
October 3, 2009 at 7:55 am #4614ParticipantLerner wrote: Not to get involved in this interesting discussion–don’t have time–but people do need to do arithmetic right. Fossil fuel burning releases to the atmosphere about 200% of the CO2 needed to account for the increase in atmospheric CO2, not 3.5%.
Sorry, disagree.
RATE OF INCREASING CONCENTRATIONS OF ATMOSPHERIC
CARBON DIOXIDE CONTROLLED BY NATURAL
TEMPERATURE VARIATIONS
http://www.agu.org/pubs/crossref/2008/2007JG000583.shtmlABSTRACT
Studies of the temperature anomalies during the last 27 years show a close relationship with
the varying increase of CO2 in the atmosphere. Volcanic eruptions and La Niñas reduce CO2
values and El Niños increase them. This close relationship strongly indicates that ocean
temperatures and the solubility of CO2 in seawater control the amount of CO2 being absorbed
or released by the oceans. It is therefore likely that the increased CO2 concentration in the
atmosphere is due to a natural global warming and that CO2 produced through fossil fuel
combustion by humans can not disrupt this balance. An advanced statistical multiregression
analysis confirms this conclusion. Therefore it is likely that there is no anthropogenic climate
change on a global scale. The natural exchange of CO2 between ocean, biomass on land and
the atmosphere is very large. In only four to five years all the CO2 in the atmosphere has been
recycled through the oceans and the biomass system. The annual anthropogenic human
production of CO2 is neutralized by nature in as little as 12 days. Recent studies of the solar
forcing, changes in cosmic radiation and its role in cloud formations explain the global
warming that has taken place since 1910.According to measurements by the Oak Ridge National Laboratory, U S DOE, the total
reservoir of CO2 in the atmosphere (expressed in carbon equivalents) is 775 Gtons,The human contribution of CO2 to the atmosphere is estimated to 7-8 Gton C per year, which is one percent of the existing CO2 in the atmosphere. If we add the absorption of CO2 into the oceans and biomass of 92+101 =
193 Gton C, we can calculate that the annual human contribution corresponds to only12 days of natural turnover.12×100% / 365 = 3.3%
I was rounding for simplicity.
October 3, 2009 at 8:40 am #4615ParticipantBrian, CO2 in the atmosphere is currently rising by about 0.5% per year. As your figures show, the amount of CO2 added to the atmosphere each year by fossil fuel burning alone (not counting deforestation) is 1% of total CO2 in the atmosphere. So, fossil fuel consumption alone is more than enough to account for the whole rise in CO2.
To see the situation clearly, imagine a water tank with a faucet and a pump. Water from the faucet enters at 1 gallon per minute and leaves by the pump at 1 gallon per minute. The amount of water in the tub—50 gallons—remains constant. Now start pouring water into the tub from a pitcher at the rate of 1 gallon per hour. The amount of water in the tank will then increase by 1 gallon per hour. ALL the increase is due to the water from the pitcher, even though that flow is much less than the flow from the faucet and the pump.
With CO2, the situation is more complex because rising temperatures cause the release of CO2 from the oceans and increased CO2 may cause increased plant growth, which drains CO2 from the atmosphere. Probably most significantly, concentrations of CO2 in the atmosphere are now a lot larger than that for equilibrium with CO2 in the oceans, leading to large absorption of CO2 by the oceans.
But there is no doubt that human-created CO2 is very large compared with the CHANGE in CO2 now occurring. It is more than double that change, not 3.5% of it. Whether or not that change in CO2 is responsible for the 0.5C increase in global temperature is a more complex issue. Have fun debating it, but keep your numbers straight.October 3, 2009 at 9:28 am #4616ParticipantLerner wrote: Brian, CO2 in the atmosphere is currently rising by about 0.5% per year. As your figures show, the amount of CO2 added to the atmosphere each year by fossil fuel burning alone (not counting deforestation) is 1% of total CO2 in the atmosphere. So, fossil fuel consumption alone is more than enough to account for the whole rise in CO2.
To see the situation clearly, imagine a water tank with a faucet and a pump. Water from the faucet enters at 1 gallon per minute and leaves by the pump at 1 gallon per minute. The amount of water in the tub—50 gallons—remains constant. Now start pouring water into the tub from a pitcher at the rate of 1 gallon per hour. The amount of water in the tank will then increase by 1 gallon per hour. ALL the increase is due to the water from the pitcher, even though that flow is much less than the flow from the faucet and the pump.
With CO2, the situation is more complex because rising temperatures cause the release of CO2 from the oceans and increased CO2 may cause increased plant growth, which drains CO2 from the atmosphere. Probably most significantly, concentrations of CO2 in the atmosphere are now a lot larger than that for equilibrium with CO2 in the oceans, leading to large absorption of CO2 by the oceans.
But there is no doubt that human-created CO2 is very large compared with the CHANGE in CO2 now occurring. It is more than double that change, not 3.5% of it. Whether or not that change in CO2 is responsible for the 0.5C increase in global temperature is a more complex issue. Have fun debating it, but keep your numbers straight.At the very least, the absorption ratios apply to the entirety of the CO2 load. The point of the article is that the behavior of ocean/air CO2 exchanges is independent of source, and in scope significantly outweighs human influence. CO2 historically/geologically etc. has risen and fallen by huge ratios, long before any human influence could possibly have existed.
Further, the 0.5% “trend” of CO2 increase is significantly smaller than diurnal or seasonal variation. It is utterly implausible to attribute seasonal or diurnal variance to humans, and in the face of that variance, plus the long historical record, it is implausible to suggest that somehow human emissions are significant variables within such a large, self-regulated system.
Examine again that geological image above ( http://www.biocab.org/Climate_Geologic_Timescale.html ) For literally hundreds of millions, indeed billions, of years CO2 and temperature went their separate ways. What changed when human CO2 release commenced? On the scale, say, of the Cambrian Era, the variance in the Holocene Epoch is minor noise on the signal.
A final note about “straight numbers”. The assertion was that the human contribution is ~3.5% of the TURNOVER (flux) of CO2. That remains true. Further, it also remains true that CO2 contributes about 3.5% of total GH gas load. (Most of the rest is H2O, which substantially overlaps, and has a wider absorption spectrum–and swings in HUGE ranges across the planet, over short and long periods of time, and in virtually every layer of the atmosphere.) Hence the net effect of 0.125% on the (changes in) GH behavior of the atmosphere. Trivial.
Addendum:
I may be overstating human influence. From the paper referenced above:A correlation (Chapter 5) between the annual increase of the CO2 concentration in the
atmosphere and the mean annual global temperature anomalies was demonstrated and human
emissions were found to be insignificant. The level of CO2 in the atmosphere reaches in a
very short time an equilibrium with the CO2 concentration in the oceans when ocean
temperatures are changing or when CO2 concentrations in the atmosphere change. This has
also been verified by measuring the reduction of Carbon-14 isotopes in the atmosphere after
the Soviet nuclear testing activities on Novaja Zemja in the 1960-ies [17].The additional greenhouse effect caused by man-made emissions (which amounts to 1% of
the total CO2 concentration in the atmosphere as earlier reported) amounts to 1% of 1% of
the total greenhouse effect in the atmosphere resulting in a total of 0,01%. This is too
insignificant to be measured due to the large natural variations.October 3, 2009 at 8:17 pm #4619ParticipantBrian. In an earlier post I stated this:
HermannH wrote:
… CO2 concentrations in the atmosphere have risen from 320 ppm to 380 ppm in the last 50 years alone. These are actual measurements not predictions or speculation. The pre-indusrial level has been estimated to have been around 280 ppm. The oceans also absorbed a significant amount of CO2 in that time frame. That is a 20% increase since 1960 and I don’t think that anybody seriously disputes the numbers nor the claim that the lion share (if not all) of the increase is the result of human activity. This number is 160 times higher than your stated value of 0.125% human contribution (unless you only count the air that we exhale). In the graph you can also see that seasonal swings are much smaller than the long term trend and diurnal variations are invisible. Where do your numbers come from? ….From your subsequent quotes I have gathered that you fundamentally dispute the above statement. Let me try to paraphrase your beliefs as I understand them now:
The daily and seasonal flux back and forth of CO2 between air/ocean/biomass is so huge that the comparatively tiny flux from human activity can’t possibly make a difference. Therefore, the observed 20% CO2 increase in the atmosphere is the result of a (temporary?) fluctuation of that naturally occurring exchange.
If this interpretation does not reflect your views please set the record straight. If, on the other hand, it is a fair representation I hope you are aware enough of the global climate change discussion to realize that your view is not the generally accepted one.
In order to have a meaningful conversation you have to start from some common ground. If two people can’t agree that 2+2=4 there is no point in starting a discussion about higher algebra.
In my initial statement I presented what I thought was ‘common ground’. I even specifically stated that I thought it was ‘common ground’.
Instead of clarifying that you disagree with what I presented as a basic assumption your response was:
Brian H wrote:
The numbers don’t even begin to add up. The hooman output in toto is a minute fraction of that change in concentration. And the lab results don’t reflect atmospheric dynamics. …And I was left scratching my head, wondering ‘what the heck does he mean?’ When I asked for clarification the response was this:
Brian H wrote:
3.5% of GH gas is CO2. 3.5% of CO2 fluctuation is hoomon (as the Ferengi say it) output. 3.5% of 3.5% is 0.125%. All covered in earlier posts.Again: ‘What the heck… ‘
I went on a wild goose chase on the Internet and through dozens of your earlier posts on this forum trying to reconstruct where you are coming from. It took all this, two posts from Eric and another two from you until I finally began to understand your views on changes in CO2 levels in the atmosphere. At least I believe I understand them now; and it takes two sentences to summarize them.
So why the hell did you not clarify your (very unconventional) position from the start?
October 4, 2009 at 6:38 am #4620ParticipantHermannH wrote: Brian. In an earlier post I stated this:
… CO2 concentrations in the atmosphere have risen from 320 ppm to 380 ppm in the last 50 years alone. These are actual measurements not predictions or speculation. The pre-indusrial level has been estimated to have been around 280 ppm. The oceans also absorbed a significant amount of CO2 in that time frame. That is a 20% increase since 1960 and I don’t think that anybody seriously disputes the numbers nor the claim that the lion share (if not all) of the increase is the result of human activity. This number is 160 times higher than your stated value of 0.125% human contribution (unless you only count the air that we exhale). In the graph you can also see that seasonal swings are much smaller than the long term trend and diurnal variations are invisible. Where do your numbers come from? ….
From your subsequent quotes I have gathered that you fundamentally dispute the above statement. Let me try to paraphrase your beliefs as I understand them now:
The daily and seasonal flux back and forth of CO2 between air/ocean/biomass is so huge that the comparatively tiny flux from human activity can’t possibly make a difference. Therefore, the observed 20% CO2 increase in the atmosphere is the result of a (temporary?) fluctuation of that naturally occurring exchange.
If this interpretation does not reflect your views please set the record straight. If, on the other hand, it is a fair representation I hope you are aware enough of the global climate change discussion to realize that your view is not the generally accepted one.
In order to have a meaningful conversation you have to start from some common ground. If two people can’t agree that 2+2=4 there is no point in starting a discussion about higher algebra.
In my initial statement I presented what I thought was ‘common ground’. I even specifically stated that I thought it was ‘common ground’.
Instead of clarifying that you disagree with what I presented as a basic assumption your response was:
Brian H wrote:
The numbers don’t even begin to add up. The hooman output in toto is a minute fraction of that change in concentration. And the lab results don’t reflect atmospheric dynamics. …And I was left scratching my head, wondering ‘what the heck does he mean?’ When I asked for clarification the response was this:
Brian H wrote:
3.5% of GH gas is CO2. 3.5% of CO2 fluctuation is hoomon (as the Ferengi say it) output. 3.5% of 3.5% is 0.125%. All covered in earlier posts.Again: ‘What the heck… ‘
I went on a wild goose chase on the Internet and through dozens of your earlier posts on this forum trying to reconstruct where you are coming from. It took all this, two posts from Eric and another two from you until I finally began to understand your views on changes in CO2 levels in the atmosphere. At least I believe I understand them now; and it takes two sentences to summarize them.
So why the hell did you not clarify your (very unconventional) position from the start?
There have been a sequence of posts; recapping the whole sequence every post is unworkable. And “unconventional” is a matter of opinion. That data-based verification has become “unconventional” in climate science is the ultimate sign that it is off doing something else besides science. Milking a giant cash cow comes to mind.October 4, 2009 at 5:29 pm #4621ParticipantBrian H wrote:
There have been a sequence of posts; recapping the whole sequence every post is unworkable.As I said, your interpretation of CO2 flux can be summed up in two sentences. But you couldn’t be bothered with that. Instead you came up with flippant one-liners and some numbers that only make sense in a very specific context.
Brian H wrote:
And “unconventional” is a matter of opinion.No it’s not! When a vast majority believes something it’s ‘conventional’, regardless of whether that belief is right or wrong. When a small minority believes something fundamentally different and the majority is not even aware of that view it’s ‘unconventional’.
I wasn’t aware of your interpretation and neither was Eric Lerner. I fact he got involved for the sole purpose of telling you to get your math straight. That makes two out of two who participated in the discussion with you.
Usually people know whether their views on a particular topic are mainstream or unconventional. I am sure Eric doesn’t believe that his views on the Big Bang or on the feasibility of FF are conventional at this time. To be unaware that your views are unconventional may a sign of delusion.
Brian H wrote:
That data-based verification has become “unconventional” in climate science is the ultimate sign that it is off doing something else besides science. Milking a giant cash cow comes to mind.Your favorite: its all a conspiracy!
Have a look at this http://noimpactman.typepad.com/blog/2008/06/the-climate-cha.html and this http://www.newsweek.com/id/32482 for some alternate conspiracies.October 4, 2009 at 7:44 pm #4622ParticipantHermannH wrote:
There have been a sequence of posts; recapping the whole sequence every post is unworkable.
As I said, your interpretation of CO2 flux can be summed up in two sentences. But you couldn’t be bothered with that. Instead you came up with flippant one-liners and some numbers that only make sense in a very specific context.
Brian H wrote:
And “unconventional” is a matter of opinion.No it’s not! When a vast majority believes something it’s ‘conventional’, regardless of whether that belief is right or wrong. When a small minority believes something fundamentally different and the majority is not even aware of that view it’s ‘unconventional’.
I wasn’t aware of your interpretation and neither was Eric Lerner. I fact he got involved for the sole purpose of telling you to get your math straight. That makes two out of two who participated in the discussion with you.
Usually people know whether their views on a particular topic are mainstream or unconventional. I am sure Eric doesn’t believe that his views on the Big Bang or on the feasibility of FF are conventional at this time. To be unaware that your views are unconventional may a sign of delusion.
Brian H wrote:
That data-based verification has become “unconventional” in climate science is the ultimate sign that it is off doing something else besides science. Milking a giant cash cow comes to mind.Your favorite: its all a conspiracy!
Have a look at this http://noimpactman.typepad.com/blog/2008/06/the-climate-cha.html and this http://www.newsweek.com/id/32482 for some alternate conspiracies.
The modelling techniques used by the IPCC are seriously substandard, and there have been numerous major shortcomings in the data selected to feed into them. Recently, 31,000 scientists and others with specific qualifications in relevant fields signed a statement rejecting the validity of the procedures and conclusions reached, on the basis that they did not adhere to any recognizable standard of scientific inquiry or verification.Politics and money rule the AGW movement. As I observed, it started when Margaret Thatcher offered to pay for “cooked” research discrediting coal as a power source because it would harm the climate, as she needed to knock the coal unions down a peg. The field and issue were basically bit players before that, but her funding brought volunteers into the arena in droves. It has been on that same track ever since.
I will repeat the question I asked above; perhaps you will care to have a go at answering it:
“Examine again that geological image above ( http://www.biocab.org/Climate_Geologic_Timescale.html ) For literally hundreds of millions, indeed billions, of years CO2 and temperature went their separate ways. What changed when human CO2 release commenced? “
October 5, 2009 at 5:48 am #4623ParticipantBrian H wrote:
The modelling techniques used by the IPCC are seriously substandard, and there have been numerous major shortcomings in the data selected to feed into them. Recently, 31,000 scientists and others with specific qualifications in relevant fields signed a statement rejecting the validity of the procedures and conclusions reached, on the basis that they did not adhere to any recognizable standard of scientific inquiry or verification.Politics and money rule the AGW movement. As I observed, it started when Margaret Thatcher offered to pay for “cooked” research discrediting coal as a power source because it would harm the climate, as she needed to knock the coal unions down a peg. The field and issue were basically bit players before that, but her funding brought volunteers into the arena in droves. It has been on that same track ever since.
If I remember correctly climate research wasn’t the major weapon that Maggy used in her clashes with the coal miners. Maggy was a trained chemist. This science background allowed her to see that perhaps there was a nugget of truth behind the concerns of climate researchers at the time.
But how about this ‘grassroots’ movement: Philip Morris wanted to discredit an EPA report that found that second hand smoke is harmful. The advice they got was to create the impression of a grassroots movement that fought against government over-regulation. They also got the advice to throw in a few other issues to make it look more authentic http://www.guardian.co.uk/environment/2006/sep/19/ethicalliving.g2:
By May 1993, as another memo from APCO to Philip Morris shows, the fake citizens’ group had a name: the Advancement of Sound Science Coalition. It was important, further letters stated, “to ensure that TASSC has a diverse group of contributors”; to “link the tobacco issue with other more ‘politically correct’ products”; and to associate scientific studies that cast smoking in a bad light with “broader questions about government research and regulations” – such as “global warming”, “nuclear waste disposal” and “biotechnology”….
TASSC’s headed notepaper names an advisory board of eight people. Three of them are listed by Exxonsecrets.org as working for organisations taking money from Exxon. One of them is Frederick Seitz, the man who wrote the Oregon Petition, and who chairs the Science and Environmental Policy Project. In 1979, Seitz became a permanent consultant to the tobacco company RJ Reynolds. He worked for the firm until at least 1987, for an annual fee of $65,000. He was in charge of deciding which medical research projects the company should fund, and handed out millions of dollars a year to American universities. The purpose of this funding, a memo from the chairman of RJ Reynolds shows, was to “refute the criticisms against cigarettes”. An undated note in the Philip Morris archive shows that it was planning a “Seitz symposium” with the help of TASSC, in which Frederick Seitz would speak to “40-60 regulators”.
The same Seitz that circulated the above mentioned Oregon Petition:
Anyone with a degree was entitled to sign it. It was attached to a letter written by Seitz, entitled Research Review of Global Warming Evidence. The lead author of the “review” that followed Seitz’s letter is a Christian fundamentalist called Arthur B Robinson. He is not a professional climate scientist. It was co-published by Robinson’s organisation – the Oregon Institute of Science and Medicine – and an outfit called the George C Marshall Institute, which has received $630,000 from ExxonMobil since 1998. The other authors were Robinson’s 22-year-old son and two employees of the George C Marshall Institute. The chairman of the George C Marshall Institute was Frederick Seitz.
If you read the article in its entirety you may understand why I alternate between laughing and cringing every time I see you mentioning that politics and money rule in the AGW movement.
Brian H wrote: I will repeat the question I asked above; perhaps you will care to have a go at answering it:
“Examine again that geological image above ( http://www.biocab.org/Climate_Geologic_Timescale.html ) For literally hundreds of millions, indeed billions, of years CO2 and temperature went their separate ways. What changed when human CO2 release commenced? “
I did look at the graph and I cannot explain it, and neither can you. I do not know what other factors were dominant for the respective time periods. Perhaps some climatologists have explanations for some of the periods.
When human CO2 release commenced the CO2 concentration in the atmosphere started to increase. The extra amount of CO2 in the atmosphere is about half of what was released in the last 200 years the rest ended up in the oceans. This has already led to increased ocean acidification: http://royalsociety.org/displaypagedoc.asp?id=13314
Perhaps you show me the courtesy and read the links that I provided and comment on them. And I do hope your response is relevant and not just a one-liner.
-
AuthorPosts
- You must be logged in to reply to this topic.