Reply To: Cap and Trade
The Focus Fusion Society › Forums › Noise, ZPE, AGW (capped*) etc. › Cap and Trade › Reply To: Cap and Trade
Brian H wrote:
The numbers don’t even begin to add up. The hooman output in toto is a minute fraction of that change in concentration. And the lab results don’t reflect atmospheric dynamics. All the IR which can be absorbed by CO2 (actually, it’s delayed on its way to outer space, not absorbed, as it is re-emitted by the CO2 molecules it warms) is already, except for a fraction of a percent (the absorption curve is asymptotic, and is now moving out on the ‘long tail’ of that last tiny fraction). The point about CH4 is that it has more slack to take up, unlike CO2, which might help reduce the cooling now beginning.
‘The numbers don’t even begin to add up.’
Did you check the links that I provided? If so, what does not add up?
Where did you find your number of 0.125% human contribution? What exactly does it mean? (Why do you keep spelling it ‘hooman’?)
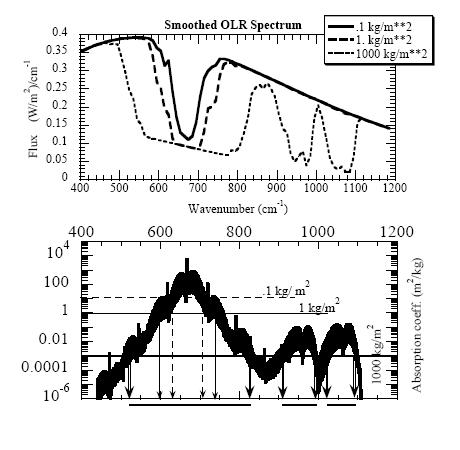
‘All the IR which can be absorbed by CO2 … is already’
This is from the IPPC report. http://www.grida.no/publications/other/ipcc_tar/?src=/climate/IPCC_tar/wg1/044.htm
It has been suggested that the absorption by CO2 is already saturated so that an increase would have no effect. This, however, is not the case. Carbon dioxide absorbs infrared radiation in the middle of its 15 mm band to the extent that radiation in the middle of this band cannot escape unimpeded: this absorption is saturated. This, however, is not the case for the band’s wings. It is because of these effects of partial saturation that the radiative forcing is not proportional to the increase in the carbon dioxide concentration but shows a logarithmic dependence. Every further doubling adds an additional 4 Wm-2 to the radiative forcing.
The other human-made greenhouse gases add to the effect of increased carbon dioxide. Their total effect at the surface is often expressed in terms of the effect of an equivalent increase in carbon dioxide.
Of course you probably won’t believe a word of it.
I found a more technical discussion here: http://www.physicsforums.com/showthread.php?t=243619
The salient point seems to be embodied in this graph: The absorption bands get wider with increased densities of CO2.